Agenda
- Introduction
- Datasets
- Train data & Test data
- Data Preprocessing
- Machine Learning Algorithms
- Supervised learning
- Regression -- Linear Regression
- Regression -- Support Vector Regression
- Classification -- Logistic Regression
- Classification -- K-Nearest Neighbors
- Classification -- Support Vector Machine
- Unsupervised learning
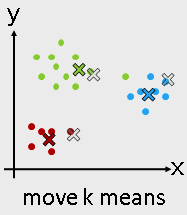
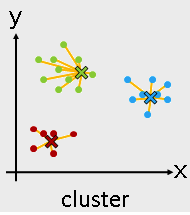
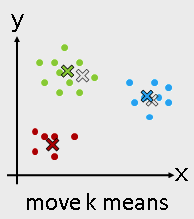
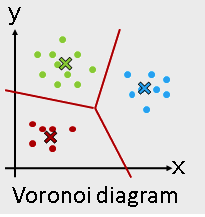
- Clustering -- K-means
- Clustering -- Hierarchical clustering
- Supervised learning
Review

Reference : https://www.wikiwand.com/en/Data_analysis
Note
import numpy as np
import pandas as pd
import matplotlib.pyplot as plt
import seaborn as sns
%matplotlib inline
Introduction
- 資料探勘 and 機器學習
- 建立在 NumPy, SciPy ,Matplotlib 套件上
- 六大功能:
a. Preprocessing (資料預處理)
b. Dimensionality reduction (資料降維)
c. Regression (迴歸)
d. Classification (分類)
e. Clustering (分群)
f. Model selection (模型評估/選取)
Introduction
Note
- Supervised learning
- Regression
- Classification
- Unsupervised learning
- Clustering
Introduction
- Machine Learning Problem:
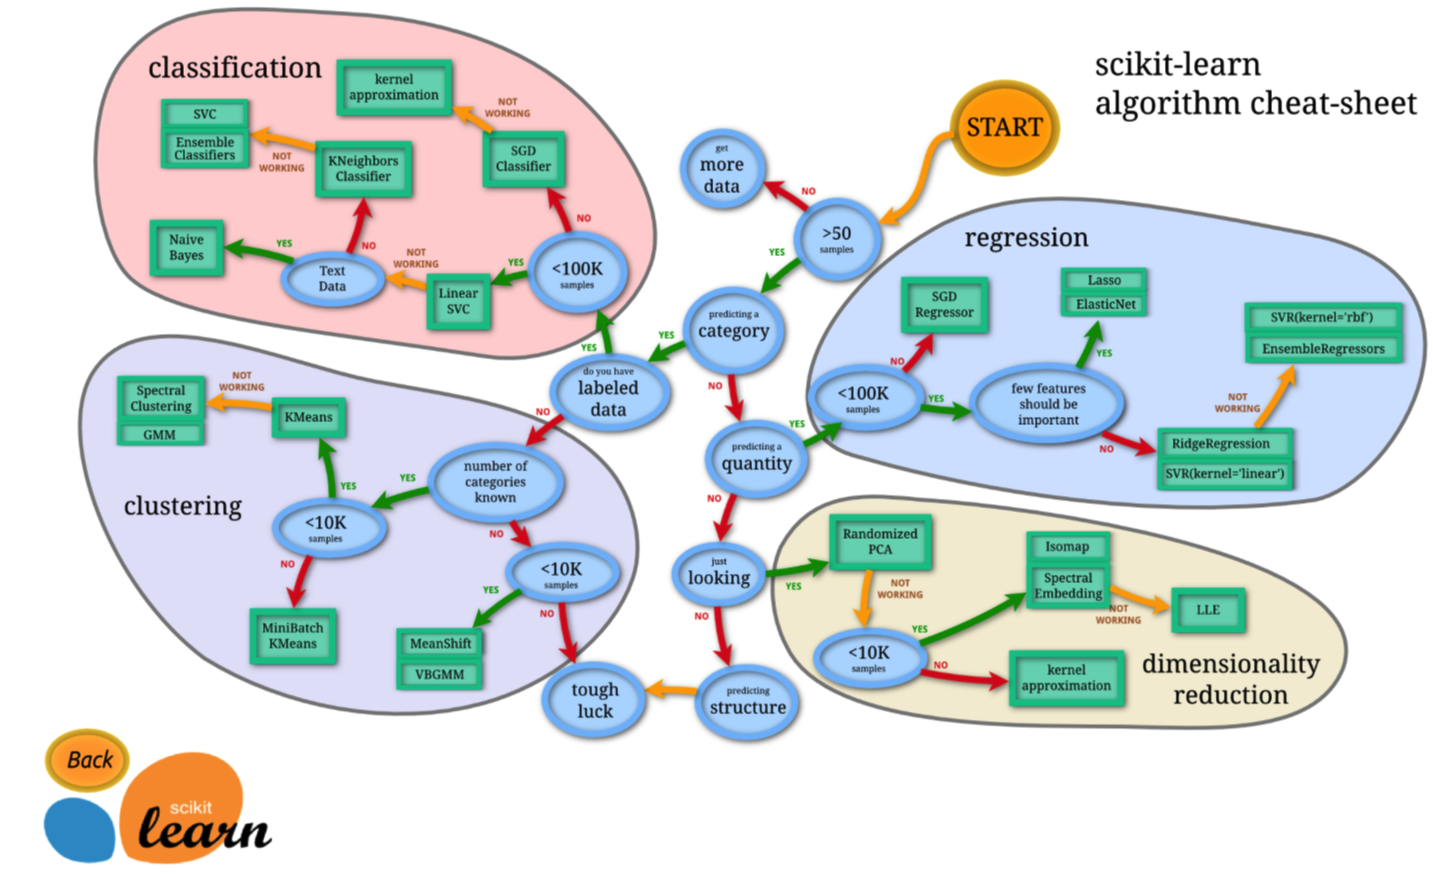
Reference : http://scikit-learn.org/stable/tutorial/machine_learning_map/
Introduction
Note
SciKits
Reference : https://scikits.appspot.com/scikits
Datasets
Note
- Scikit-Learn 針對不同資料集使用不同的 load 指令
- 格式:
load_資料集名稱()
from sklearn import datasets
- Dataset (boston)
boston = datasets.load_boston()
type(boston)
sklearn.utils.Bunch
The Bunch object in Scikit-Learn is simply a dictionary that exposes dictionary keys as properties so that you can access them with dot notation.
boston.keys()
dict_keys(['data', 'target', 'feature_names', 'DESCR'])
- data:解釋變數
- target:反應變數
- feature_names:變數名稱說明
- DESCR:資料描述
boston.DESCR
"Boston House Prices dataset\n===========================\n\nNotes\n------\nData Set Characteristics: \n\n :Number of Instances: 506 \n\n :Number of Attributes: 13 numeric/categorical predictive\n \n :Median Value (attribute 14) is usually the target\n\n :Attribute Information (in order):\n - CRIM per capita crime rate by town\n - ZN proportion of residential land zoned for lots over 25,000 sq.ft.\n - INDUS proportion of non-retail business acres per town\n - CHAS Charles River dummy variable (= 1 if tract bounds river; 0 otherwise)\n - NOX nitric oxides concentration (parts per 10 million)\n - RM average number of rooms per dwelling\n - AGE proportion of owner-occupied units built prior to 1940\n - DIS weighted distances to five Boston employment centres\n - RAD index of accessibility to radial highways\n - TAX full-value property-tax rate per $10,000\n - PTRATIO pupil-teacher ratio by town\n - B 1000(Bk - 0.63)^2 where Bk is the proportion of blacks by town\n - LSTAT % lower status of the population\n - MEDV Median value of owner-occupied homes in $1000's\n\n :Missing Attribute Values: None\n\n :Creator: Harrison, D. and Rubinfeld, D.L.\n\nThis is a copy of UCI ML housing dataset.\nhttp://archive.ics.uci.edu/ml/datasets/Housing\n\n\nThis dataset was taken from the StatLib library which is maintained at Carnegie Mellon University.\n\nThe Boston house-price data of Harrison, D. and Rubinfeld, D.L. 'Hedonic\nprices and the demand for clean air', J. Environ. Economics & Management,\nvol.5, 81-102, 1978. Used in Belsley, Kuh & Welsch, 'Regression diagnostics\n...', Wiley, 1980. N.B. Various transformations are used in the table on\npages 244-261 of the latter.\n\nThe Boston house-price data has been used in many machine learning papers that address regression\nproblems. \n \n**References**\n\n - Belsley, Kuh & Welsch, 'Regression diagnostics: Identifying Influential Data and Sources of Collinearity', Wiley, 1980. 244-261.\n - Quinlan,R. (1993). Combining Instance-Based and Model-Based Learning. In Proceedings on the Tenth International Conference of Machine Learning, 236-243, University of Massachusetts, Amherst. Morgan Kaufmann.\n - many more! (see http://archive.ics.uci.edu/ml/datasets/Housing)\n"
boston.feature_names
array(['CRIM', 'ZN', 'INDUS', 'CHAS', 'NOX', 'RM', 'AGE', 'DIS', 'RAD',
       'TAX', 'PTRATIO', 'B', 'LSTAT'],
      dtype='<U7')
分别是房屋均價及周邊犯罪率、是否在河邊等相關信息
boston.data.shape
(506, 13)
- 確認 boston ( target ) 的維度
boston.target.shape
(506,)
from sklearn import datasets
- Dataset (iris)
iris = datasets.load_iris()
鳶尾花(iris)資料集是非常著名的生物資訊資料集之一,取自美國加州大學歐文分校的機械學習資料庫
iris.keys()
dict_keys(['data', 'target', 'target_names', 'DESCR', 'feature_names'])
- data:解釋變數
- target:反應變數
- target_names:反應變數的類別名稱
- feature_names:變數名稱說明
- DESCR:資料描述
iris.DESCR

iris.target_names
array(['setosa', 'versicolor', 'virginica'],
      dtype='<U10')

iris.feature_names
['sepal length (cm)',
 'sepal width (cm)',
 'petal length (cm)',
 'petal width (cm)']
分别是花萼、花瓣等相關信息
iris.data.shape
(150, 4)
- 確認 iris ( target ) 的維度
iris.target.shape
(150,)
Question
想分析 Boston 這組資料。根據前幾堂課學到的方法做一些,你認為在進入分析(模型)前應該要做的事?
Review
Data science process flowchart

Reference : https://www.wikiwand.com/en/Data_analysis
Datasets -- Boston
Data Prepare
boston_df = pd.DataFrame( boston.data )
boston_df.columns = boston.feature_names
boston_df['PRICE'] = boston.target
確認資料維度
boston_df.shape
(506, 14)
Datastes -- Boston
可以利用前五筆資料,來看一下資料狀況
boston_df.head()
| CRIM | ZN | INDUS | CHAS | NOX | RM | AGE | DIS | RAD | TAX | PTRATIO | B | LSTAT | PRICE | |
|---|---|---|---|---|---|---|---|---|---|---|---|---|---|---|
| 0 | 0.00632 | 18.0 | 2.31 | 0.0 | 0.538 | 6.575 | 65.2 | 4.0900 | 1.0 | 296.0 | 15.3 | 396.90 | 4.98 | 24.0 |
| 1 | 0.02731 | 0.0 | 7.07 | 0.0 | 0.469 | 6.421 | 78.9 | 4.9671 | 2.0 | 242.0 | 17.8 | 396.90 | 9.14 | 21.6 |
| 2 | 0.02729 | 0.0 | 7.07 | 0.0 | 0.469 | 7.185 | 61.1 | 4.9671 | 2.0 | 242.0 | 17.8 | 392.83 | 4.03 | 34.7 |
| 3 | 0.03237 | 0.0 | 2.18 | 0.0 | 0.458 | 6.998 | 45.8 | 6.0622 | 3.0 | 222.0 | 18.7 | 394.63 | 2.94 | 33.4 |
| 4 | 0.06905 | 0.0 | 2.18 | 0.0 | 0.458 | 7.147 | 54.2 | 6.0622 | 3.0 | 222.0 | 18.7 | 396.90 | 5.33 | 36.2 |
Datastes -- Boston
確認資料中是否有遺失值
boston_df.isnull().sum()
CRIM       0
ZN         0
INDUS      0
CHAS       0
NOX        0
RM         0
AGE        0
DIS        0
RAD        0
TAX        0
PTRATIO    0
B          0
LSTAT      0
PRICE      0
dtype: int64
Datastes -- Boston
基本敘述統計
boston_df.describe()
| CRIM | ZN | INDUS | CHAS | NOX | RM | AGE | DIS | RAD | TAX | PTRATIO | B | LSTAT | PRICE | |
|---|---|---|---|---|---|---|---|---|---|---|---|---|---|---|
| count | 506.000000 | 506.000000 | 506.000000 | 506.000000 | 506.000000 | 506.000000 | 506.000000 | 506.000000 | 506.000000 | 506.000000 | 506.000000 | 506.000000 | 506.000000 | 506.000000 |
| mean | 3.593761 | 11.363636 | 11.136779 | 0.069170 | 0.554695 | 6.284634 | 68.574901 | 3.795043 | 9.549407 | 408.237154 | 18.455534 | 356.674032 | 12.653063 | 22.532806 |
| std | 8.596783 | 23.322453 | 6.860353 | 0.253994 | 0.115878 | 0.702617 | 28.148861 | 2.105710 | 8.707259 | 168.537116 | 2.164946 | 91.294864 | 7.141062 | 9.197104 |
| min | 0.006320 | 0.000000 | 0.460000 | 0.000000 | 0.385000 | 3.561000 | 2.900000 | 1.129600 | 1.000000 | 187.000000 | 12.600000 | 0.320000 | 1.730000 | 5.000000 |
| 25% | 0.082045 | 0.000000 | 5.190000 | 0.000000 | 0.449000 | 5.885500 | 45.025000 | 2.100175 | 4.000000 | 279.000000 | 17.400000 | 375.377500 | 6.950000 | 17.025000 |
| 50% | 0.256510 | 0.000000 | 9.690000 | 0.000000 | 0.538000 | 6.208500 | 77.500000 | 3.207450 | 5.000000 | 330.000000 | 19.050000 | 391.440000 | 11.360000 | 21.200000 |
| 75% | 3.647423 | 12.500000 | 18.100000 | 0.000000 | 0.624000 | 6.623500 | 94.075000 | 5.188425 | 24.000000 | 666.000000 | 20.200000 | 396.225000 | 16.955000 | 25.000000 |
| max | 88.976200 | 100.000000 | 27.740000 | 1.000000 | 0.871000 | 8.780000 | 100.000000 | 12.126500 | 24.000000 | 711.000000 | 22.000000 | 396.900000 | 37.970000 | 50.000000 |
Datastes -- Boston
探索型資料視覺化
sns.pairplot(boston_df)
<seaborn.axisgrid.PairGrid at 0x1064ee240>
Question
想分析 iris 這組資料。根據前幾堂課學到的方法做一些,先來探索一下這組資料吧!
Datasets -- Iris
Data Prepare
iris_df = pd.DataFrame( iris.data )
iris_df.columns = iris.feature_names
iris_df['species'] = iris.target_names[iris.target]
確認資料維度
iris_df.shape
(150, 5)
Datasets -- Iris
可以利用前五筆資料,來看一下資料狀況
iris_df.head()
| sepal length (cm) | sepal width (cm) | petal length (cm) | petal width (cm) | species | |
|---|---|---|---|---|---|
| 0 | 5.1 | 3.5 | 1.4 | 0.2 | setosa |
| 1 | 4.9 | 3.0 | 1.4 | 0.2 | setosa |
| 2 | 4.7 | 3.2 | 1.3 | 0.2 | setosa |
| 3 | 4.6 | 3.1 | 1.5 | 0.2 | setosa |
| 4 | 5.0 | 3.6 | 1.4 | 0.2 | setosa |
Datasets -- Iris
確認資料中是否有遺失值
iris_df.isnull().sum()
sepal length (cm)    0
sepal width (cm)     0
petal length (cm)    0
petal width (cm)     0
species              0
dtype: int64
Datasets -- Iris
基本敘述統計
iris_df.describe()
| sepal length (cm) | sepal width (cm) | petal length (cm) | petal width (cm) | |
|---|---|---|---|---|
| count | 150.000000 | 150.000000 | 150.000000 | 150.000000 |
| mean | 5.843333 | 3.054000 | 3.758667 | 1.198667 |
| std | 0.828066 | 0.433594 | 1.764420 | 0.763161 |
| min | 4.300000 | 2.000000 | 1.000000 | 0.100000 |
| 25% | 5.100000 | 2.800000 | 1.600000 | 0.300000 |
| 50% | 5.800000 | 3.000000 | 4.350000 | 1.300000 |
| 75% | 6.400000 | 3.300000 | 5.100000 | 1.800000 |
| max | 7.900000 | 4.400000 | 6.900000 | 2.500000 |
iris_df["species"].value_counts()
setosa        50
versicolor    50
virginica     50
Name: species, dtype: int64
Datasets -- Iris
探索型資料視覺化
sns.pairplot(iris_df)
<seaborn.axisgrid.PairGrid at 0x105c69470>
Datasets -- Iris
探索型資料視覺化
sns.pairplot(iris_df ,hue='species')
<seaborn.axisgrid.PairGrid at 0x1161ad5c0>
Datasets -- Iris
探索型資料視覺化
sns.pairplot(iris_df ,hue='species',diag_kind="kde")
<seaborn.axisgrid.PairGrid at 0x117338208>
Datasets -- Iris
探索型資料視覺化
sns.boxplot(x="species", y="petal length (cm)", data=iris_df)
<matplotlib.axes._subplots.AxesSubplot at 0x118697198>
Train data & Test data
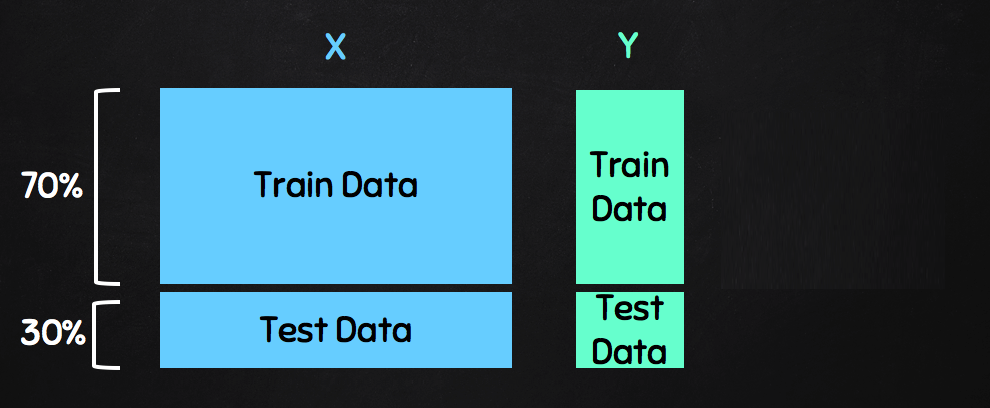
Train data & Test data
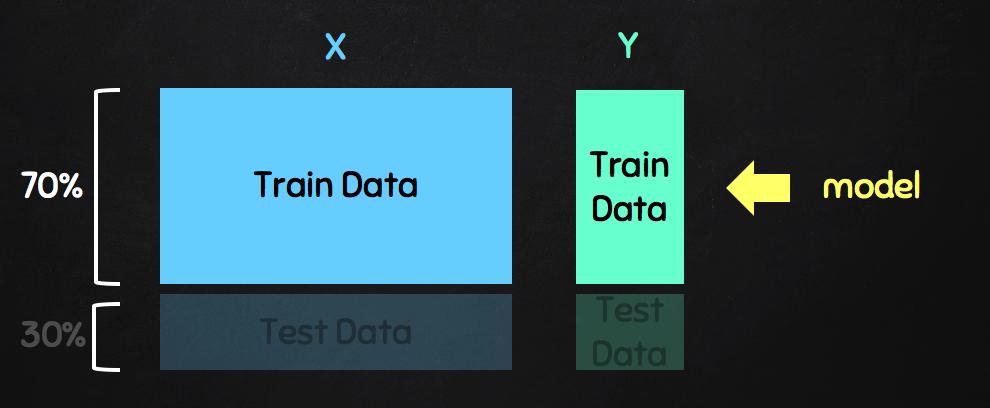
Train data & Test data
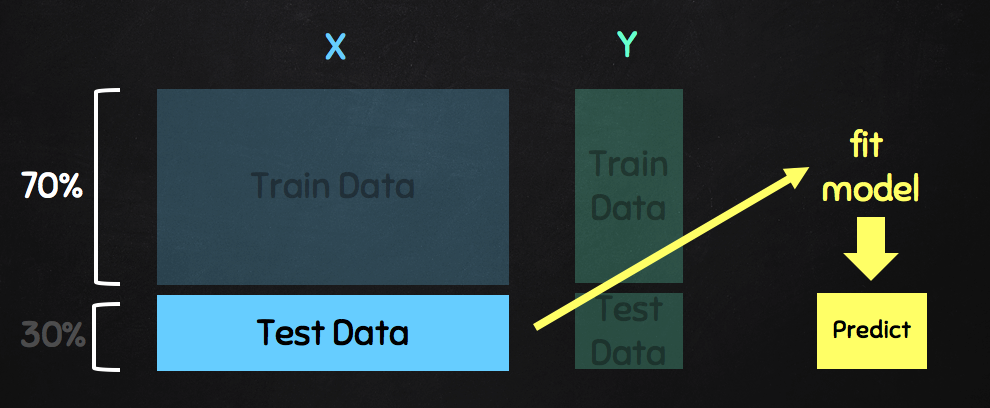
Train data & Test data
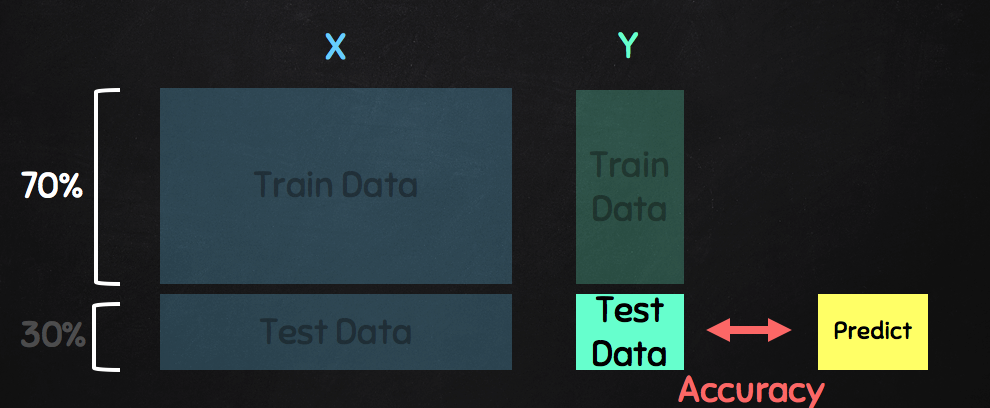
Train data & Test data -- Boston
Choose Data
B_X = boston_df.drop('PRICE',axis=1)
B_y = boston_df['PRICE']
Train data & Test data -- Boston
Training and testing
from sklearn.model_selection import train_test_split
B_X_train, B_X_test, B_y_train, B_y_test = train_test_split(B_X , B_y , test_size = 0.2, random_state = 0)
Train data & Test data -- Iris
Choose Data
I_X = iris_df.loc[:, ['petal length (cm)','petal width (cm)']]
I_y = iris.target
Train data & Test data -- Iris
Training and testing
from sklearn.model_selection import train_test_split
I_X_train, I_X_test, I_y_train, I_y_test = train_test_split(I_X, I_y, test_size = 0.3, random_state = 0)
Machine Learning Algorithms -- Supervised learning
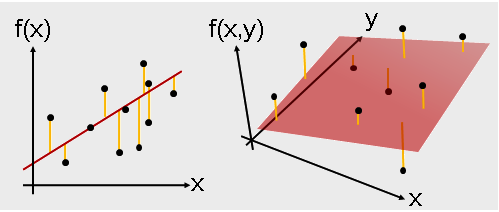
- Regression
- Linear Regression
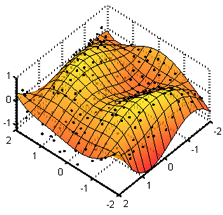
- Support Vector Regression
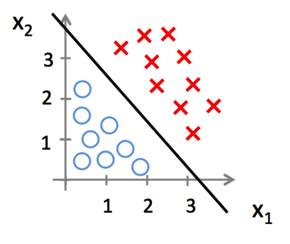
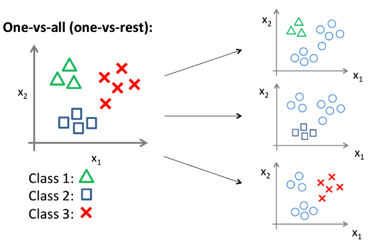
- Classification
- Logistic Regression
- K-Nearest Neighbors
- Support Vector Machine
from sklearn.linear_model import LinearRegression
Use LinearRegression
lm = LinearRegression()
lm.fit( B_X_train.values, B_y_train.values )
/usr/local/lib/python3.6/site-packages/scipy/linalg/basic.py:1018: RuntimeWarning: internal gelsd driver lwork query error, required iwork dimension not returned. This is likely the result of LAPACK bug 0038, fixed in LAPACK 3.2.2 (released July 21, 2010). Falling back to 'gelss' driver.
  warnings.warn(mesg, RuntimeWarning)
LinearRegression(copy_X=True, fit_intercept=True, n_jobs=1, normalize=False)
print(lm.intercept_)
38.1386927134
Training Model ( coefficient )
print(lm.coef_)
[ -1.18410318e-01   4.47550643e-02   5.85674689e-03   2.34230117e+00
  -1.61634024e+01   3.70135143e+00  -3.04553661e-03  -1.38664542e+00
   2.43784171e-01  -1.09856157e-02  -1.04699133e+00   8.22014729e-03
  -4.93642452e-01]
Note
Training Model ( features and coefficients )
pd.DataFrame(list( zip(B_X_train.columns,lm.coef_) ),columns=['features','estimatedCoeffs'])
| features | estimatedCoeffs | |
|---|---|---|
| 0 | CRIM | -0.118410 |
| 1 | ZN | 0.044755 |
| 2 | INDUS | 0.005857 |
| 3 | CHAS | 2.342301 |
| 4 | NOX | -16.163402 |
| 5 | RM | 3.701351 |
| 6 | AGE | -0.003046 |
| 7 | DIS | -1.386645 |
| 8 | RAD | 0.243784 |
| 9 | TAX | -0.010986 |
| 10 | PTRATIO | -1.046991 |
| 11 | B | 0.008220 |
| 12 | LSTAT | -0.493642 |
from sklearn.feature_selection import f_regression
print(f_regression(B_X_train, B_y_train)[1])
[  1.24951397e-17   8.53455987e-18   5.27647041e-30   3.33700835e-04
   1.67294465e-22   5.64340813e-62   4.20176291e-18   9.08403584e-09
   3.66673466e-19   2.94014039e-28   3.07127177e-35   2.18386516e-13
   6.88510971e-76]
Note
小數位數
print(f_regression(B_X_train, B_y_train)[1].round(decimals=5))
[ 0.       0.       0.       0.00033  0.       0.       0.       0.       0.
  0.       0.       0.       0.     ]
B_y_predict = lm.predict(B_X_test)
pd.DataFrame( list(zip(B_y_test.values,B_y_predict)), columns=['Measured','Predicted'] )
| Measured | Predicted | |
|---|---|---|
| 0 | 22.6 | 24.890130 |
| 1 | 50.0 | 23.724882 |
| 2 | 23.0 | 29.372133 |
| 3 | 8.3 | 12.140103 |
| 4 | 21.2 | 21.446865 |
| 5 | 19.9 | 19.286453 |
| 6 | 20.6 | 20.496373 |
| 7 | 18.7 | 21.361896 |
| 8 | 16.1 | 18.901879 |
| 9 | 18.6 | 19.892403 |
| 10 | 8.8 | 5.148872 |
| 11 | 17.2 | 16.346841 |
| 12 | 14.9 | 17.060125 |
| 13 | 10.5 | 5.609031 |
| 14 | 50.0 | 40.004621 |
| 15 | 29.0 | 32.494273 |
| 16 | 23.0 | 22.460817 |
| 17 | 33.3 | 36.855865 |
| 18 | 29.4 | 30.865793 |
| 19 | 21.0 | 23.154780 |
| 20 | 23.8 | 24.776560 |
| 21 | 19.1 | 24.679962 |
| 22 | 20.4 | 20.593782 |
| 23 | 29.1 | 30.356250 |
| 24 | 19.3 | 22.426400 |
| 25 | 23.1 | 10.228738 |
| 26 | 19.6 | 17.648142 |
| 27 | 19.4 | 18.260385 |
| 28 | 38.7 | 35.530774 |
| 29 | 18.7 | 20.961253 |
| ... | ... | ... |
| 72 | 23.5 | 30.734731 |
| 73 | 31.2 | 28.828630 |
| 74 | 23.7 | 25.901463 |
| 75 | 7.4 | 5.239417 |
| 76 | 48.3 | 36.712836 |
| 77 | 24.4 | 23.774485 |
| 78 | 22.6 | 27.271346 |
| 79 | 18.3 | 19.294855 |
| 80 | 23.3 | 28.624284 |
| 81 | 17.1 | 19.178398 |
| 82 | 27.9 | 18.975513 |
| 83 | 44.8 | 37.816238 |
| 84 | 50.0 | 39.208833 |
| 85 | 23.0 | 23.714100 |
| 86 | 21.4 | 24.934828 |
| 87 | 10.2 | 15.850637 |
| 88 | 23.3 | 26.096484 |
| 89 | 23.2 | 16.677999 |
| 90 | 18.9 | 15.833155 |
| 91 | 13.4 | 13.065319 |
| 92 | 21.9 | 24.722807 |
| 93 | 24.8 | 31.254435 |
| 94 | 11.9 | 22.171410 |
| 95 | 24.3 | 20.251676 |
| 96 | 13.8 | 0.596340 |
| 97 | 24.7 | 25.445216 |
| 98 | 14.1 | 15.521760 |
| 99 | 18.7 | 17.937782 |
| 100 | 28.1 | 25.306178 |
| 101 | 19.8 | 22.372220 |
102 rows × 2 columns
plt.scatter(B_y_test.values,B_y_predict,s=2)
plt.plot([B_y_test.values.min(), B_y_test.values.max()], [B_y_test.values.min(), B_y_test.values.max()], 'k--', lw=2)
plt.ylabel('Predicted')
plt.xlabel('Measured')
<matplotlib.text.Text at 0x118f4cc50>
from sklearn.metrics import mean_squared_error
mse = mean_squared_error(B_y_test.values, B_y_predict)
print("MSE : ",mse)
MSE : 33.4507089677
R_2 = lm.score(B_X_train, B_y_train)
print("R-squared  : ",R_2)
R-squared : 0.772971872657
- Adjusted R-squared
adj_R_2 = R_2 - (1 - R_2) * (B_X_train.shape[1] / (B_X_train.shape[0] - B_X_train.shape[1] - 1))
print("Adjusted R-squared : ",adj_R_2)
Adjusted R-squared : 0.765404268412
from sklearn.svm import SVR
Use Support Vector Regression
svr = SVR(kernel='rbf')
rbf : 高斯徑向基底函數
svr.fit( B_X_train.values, B_y_train.values )
SVR(C=1.0, cache_size=200, coef0=0.0, degree=3, epsilon=0.1, gamma='auto',
  kernel='rbf', max_iter=-1, shrinking=True, tol=0.001, verbose=False)
B_y_predict_svr = svr.predict(B_X_test)
pd.DataFrame( list(zip(B_y_test.values,B_y_predict_svr)), columns=['Measured','Predicted'] )
| Measured | Predicted | |
|---|---|---|
| 0 | 22.6 | 21.360372 |
| 1 | 50.0 | 21.360428 |
| 2 | 23.0 | 21.375869 |
| 3 | 8.3 | 21.088170 |
| 4 | 21.2 | 21.357921 |
| 5 | 19.9 | 21.294222 |
| 6 | 20.6 | 21.318502 |
| 7 | 18.7 | 20.856544 |
| 8 | 16.1 | 21.360407 |
| 9 | 18.6 | 21.360407 |
| 10 | 8.8 | 21.360407 |
| 11 | 17.2 | 21.360209 |
| 12 | 14.9 | 20.876751 |
| 13 | 10.5 | 21.304793 |
| 14 | 50.0 | 21.541168 |
| 15 | 29.0 | 21.360566 |
| 16 | 23.0 | 21.360436 |
| 17 | 33.3 | 21.389027 |
| 18 | 29.4 | 21.360408 |
| 19 | 21.0 | 21.414940 |
| 20 | 23.8 | 21.471958 |
| 21 | 19.1 | 21.346785 |
| 22 | 20.4 | 21.314222 |
| 23 | 29.1 | 21.709732 |
| 24 | 19.3 | 21.360222 |
| 25 | 23.1 | 21.360407 |
| 26 | 19.6 | 21.224352 |
| 27 | 19.4 | 21.360407 |
| 28 | 38.7 | 21.362649 |
| 29 | 18.7 | 20.928249 |
| ... | ... | ... |
| 72 | 23.5 | 21.360420 |
| 73 | 31.2 | 21.360407 |
| 74 | 23.7 | 21.851062 |
| 75 | 7.4 | 21.360025 |
| 76 | 48.3 | 21.388638 |
| 77 | 24.4 | 21.423946 |
| 78 | 22.6 | 21.438740 |
| 79 | 18.3 | 20.909480 |
| 80 | 23.3 | 21.360407 |
| 81 | 17.1 | 18.860371 |
| 82 | 27.9 | 21.360405 |
| 83 | 44.8 | 21.501592 |
| 84 | 50.0 | 21.395877 |
| 85 | 23.0 | 21.367203 |
| 86 | 21.4 | 21.353663 |
| 87 | 10.2 | 21.360407 |
| 88 | 23.3 | 21.673876 |
| 89 | 23.2 | 21.360377 |
| 90 | 18.9 | 21.360407 |
| 91 | 13.4 | 21.360402 |
| 92 | 21.9 | 21.360407 |
| 93 | 24.8 | 21.360407 |
| 94 | 11.9 | 21.200132 |
| 95 | 24.3 | 21.360407 |
| 96 | 13.8 | 21.343289 |
| 97 | 24.7 | 21.360407 |
| 98 | 14.1 | 21.360405 |
| 99 | 18.7 | 21.379847 |
| 100 | 28.1 | 21.361395 |
| 101 | 19.8 | 21.121805 |
102 rows × 2 columns
plt.scatter(B_y_test.values,B_y_predict_svr,s=2)
plt.plot([B_y_test.values.min(), B_y_test.values.max()], [B_y_test.values.min(), B_y_test.values.max()], 'k--', lw=2)
plt.ylabel('Predicted')
plt.xlabel('Measured')
<matplotlib.text.Text at 0x118fd8d68>
Question
WHY ??
資料標準化 
from sklearn.preprocessing import StandardScaler
scaler = StandardScaler()
scaler.fit(B_X_train)
B_X_train_s = scaler.transform(B_X_train)
B_X_test_s = scaler.transform(B_X_test)
svr.fit( B_X_train_s, B_y_train.values )
SVR(C=1.0, cache_size=200, coef0=0.0, degree=3, epsilon=0.1, gamma='auto',
  kernel='rbf', max_iter=-1, shrinking=True, tol=0.001, verbose=False)
B_y_predict_svr_s = svr.predict(B_X_test_s)
plt.scatter(B_y_test.values,B_y_predict_svr_s,s=2)
plt.plot([B_y_test.values.min(), B_y_test.values.max()], [B_y_test.values.min(), B_y_test.values.max()], 'k--', lw=2)
plt.ylabel('Predicted')
plt.xlabel('Measured')
<matplotlib.text.Text at 0x118ffc908>
Data Preprocessing
- StandardScaler $$ \acute{x} = \frac{x - \bar{x}}{\sigma} $$
- MinMaxScaler $$ \acute{x} = \frac{x - min(x)}{max(x) - min(x)} $$
- Normalizer $$ \acute{x} = \frac{x}{\lVert x \rVert} $$
Data Preprocessing
Note 
不要顯示科學計算符號,規定顯示小數五位
np.set_printoptions(precision = 5, suppress = True)
print("Mean : ",I_X.values.mean(axis=0))
print("Std : ",I_X.values.std(axis=0))
print("Max : ",I_X.values.max(axis=0))
print("Min : ",I_X.values.min(axis=0))
Mean :  [ 3.75867  1.19867]
Std :  [ 1.75853  0.76061]
Max :  [ 6.9  2.5]
Min :  [ 1.   0.1]
Data Preprocessing
from sklearn import preprocessing
standard = preprocessing.StandardScaler()
standard.fit(I_X)
I_X_s = standard.transform(I_X)
print("Mean : ",I_X_s.mean(axis=0))
print("Std : ",I_X_s.std(axis=0))
print("Max : ",I_X_s.max(axis=0))
print("Min : ",I_X_s.min(axis=0))
Mean :  [-0. -0.]
Std :  [ 1.  1.]
Max :  [ 1.78634  1.7109 ]
Min :  [-1.56874 -1.44445]
minmax = preprocessing.MinMaxScaler()
minmax.fit(I_X)
I_X_m = minmax.transform(I_X)
print("Mean : ",I_X_m.mean(axis=0))
print("Std : ",I_X_m.std(axis=0))
print("Max : ",I_X_m.max(axis=0))
print("Min : ",I_X_m.min(axis=0))
Mean :  [ 0.46757  0.45778]
Std :  [ 0.29806  0.31692]
Max :  [ 1.  1.]
Min :  [ 0.  0.]
normal = preprocessing.Normalizer()
normal.fit(I_X)
I_X_n = normal.transform(I_X)
print("Mean : ",I_X_n.mean(axis=0))
print("Std : ",I_X_n.std(axis=0))
print("Max : ",I_X_n.max(axis=0))
print("Min : ",I_X_n.min(axis=0))
Mean :  [ 0.95911  0.26772]
Std :  [ 0.02265  0.08904]
Max :  [ 0.99779  0.4258 ]
Min :  [ 0.90482  0.06652]
Machine Learning Algorithms -- Supervised learning
- Regression
- Linear Regression
- Support Vector Regression
- Classification
- Logistic Regression
- K-Nearest Neighbors
- Support Vector Machine
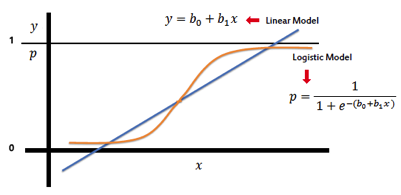
Reference : http://www.saedsayad.com/logistic_regression.htm
Note 
def SigmoidFunc(x):
    return 1 / (1 + np.exp(-x))
Note 
Sigmoid_x = np.arange(-20, 20, 0.01)
Sigmoid_y = SigmoidFunc(Sigmoid_x)
plt.plot(Sigmoid_x, Sigmoid_y)
plt.axvline(0, ls='dotted', color='black', alpha=0.5)
plt.axhline(y=0, ls='dotted', color='black', alpha=0.5)
plt.axhline(y=0.5, ls = 'dotted', color='black', alpha=0.5)
plt.axhline(y=1, ls='dotted', color='black', alpha=0.5)
plt.yticks([0.0, 0.5, 1.0])
plt.ylim(-0.05, 1.05)
plt.title("Sigmoid Function")
plt.show()
from sklearn.linear_model import LogisticRegression
Use LogisticRegression
logit = LogisticRegression()
logit.fit( I_X_train, I_y_train )
LogisticRegression(C=1.0, class_weight=None, dual=False, fit_intercept=True,
          intercept_scaling=1, max_iter=100, multi_class='ovr', n_jobs=1,
          penalty='l2', random_state=None, solver='liblinear', tol=0.0001,
          verbose=0, warm_start=False)
y_logit_predict = logit.predict( I_X_test )
Compare Predict Value and Measure Value
pd.DataFrame( list(zip( I_y_test, y_logit_predict)), columns=['Measured','Predicted'] )
| Measured | Predicted | |
|---|---|---|
| 0 | 2 | 2 |
| 1 | 1 | 1 |
| 2 | 0 | 0 |
| 3 | 2 | 2 |
| 4 | 0 | 0 |
| 5 | 2 | 2 |
| 6 | 0 | 0 |
| 7 | 1 | 2 |
| 8 | 1 | 2 |
| 9 | 1 | 2 |
| 10 | 2 | 1 |
| 11 | 1 | 2 |
| 12 | 1 | 1 |
| 13 | 1 | 2 |
| 14 | 1 | 2 |
| 15 | 0 | 0 |
| 16 | 1 | 2 |
| 17 | 1 | 1 |
| 18 | 0 | 0 |
| 19 | 0 | 0 |
| 20 | 2 | 2 |
| 21 | 1 | 2 |
| 22 | 0 | 0 |
| 23 | 0 | 0 |
| 24 | 2 | 2 |
| 25 | 0 | 0 |
| 26 | 0 | 0 |
| 27 | 1 | 2 |
| 28 | 1 | 1 |
| 29 | 0 | 0 |
| 30 | 2 | 2 |
| 31 | 1 | 2 |
| 32 | 0 | 0 |
| 33 | 2 | 2 |
| 34 | 2 | 2 |
| 35 | 1 | 2 |
| 36 | 0 | 0 |
| 37 | 1 | 2 |
| 38 | 1 | 2 |
| 39 | 1 | 1 |
| 40 | 2 | 2 |
| 41 | 0 | 0 |
| 42 | 2 | 2 |
| 43 | 0 | 0 |
| 44 | 0 | 0 |
Compare Predict Value and Measure Value
pd.DataFrame( list(zip(iris.target_names[ I_y_test],
                       iris.target_names[ y_logit_predict])), columns=['Measured','Predicted'] )
| Measured | Predicted | |
|---|---|---|
| 0 | virginica | virginica |
| 1 | versicolor | versicolor |
| 2 | setosa | setosa |
| 3 | virginica | virginica |
| 4 | setosa | setosa |
| 5 | virginica | virginica |
| 6 | setosa | setosa |
| 7 | versicolor | virginica |
| 8 | versicolor | virginica |
| 9 | versicolor | virginica |
| 10 | virginica | versicolor |
| 11 | versicolor | virginica |
| 12 | versicolor | versicolor |
| 13 | versicolor | virginica |
| 14 | versicolor | virginica |
| 15 | setosa | setosa |
| 16 | versicolor | virginica |
| 17 | versicolor | versicolor |
| 18 | setosa | setosa |
| 19 | setosa | setosa |
| 20 | virginica | virginica |
| 21 | versicolor | virginica |
| 22 | setosa | setosa |
| 23 | setosa | setosa |
| 24 | virginica | virginica |
| 25 | setosa | setosa |
| 26 | setosa | setosa |
| 27 | versicolor | virginica |
| 28 | versicolor | versicolor |
| 29 | setosa | setosa |
| 30 | virginica | virginica |
| 31 | versicolor | virginica |
| 32 | setosa | setosa |
| 33 | virginica | virginica |
| 34 | virginica | virginica |
| 35 | versicolor | virginica |
| 36 | setosa | setosa |
| 37 | versicolor | virginica |
| 38 | versicolor | virginica |
| 39 | versicolor | versicolor |
| 40 | virginica | virginica |
| 41 | setosa | setosa |
| 42 | virginica | virginica |
| 43 | setosa | setosa |
| 44 | setosa | setosa |
print(iris.target_names)
print(logit.predict_proba( I_X_test.iloc[0, :].values.reshape(1, 2)))
print(logit.predict_proba( I_X_test.iloc[1, :].values.reshape(1, 2)))
print(logit.predict_proba( I_X_test.iloc[2, :].values.reshape(1, 2)))
['setosa' 'versicolor' 'virginica']
[[ 0.00368  0.20336  0.79297]]
[[ 0.14155  0.53555  0.3229 ]]
[[ 0.72601  0.23859  0.0354 ]]
Note

from sklearn.metrics import accuracy_score
print('Accuracy:',accuracy_score( I_y_test, y_logit_predict))
Accuracy: 0.688888888889
Note
Decision boundary
from matplotlib.colors import ListedColormap
def DecisionBoundary_plot(X, y, method, h=.02):
    markers = ('o', '*', '^')
    colors = ('yellow', 'magenta', 'cyan')
    colormap = ListedColormap(colors[:len(np.unique(y))])

    x_min, x_max = X[:,0].min()-1, X[:,0].max()+1
    y_min, y_max = X[:,1].min()-1, X[:,1].max()+1
    xx, yy = np.meshgrid(np.arange(x_min, x_max, h),
                         np.arange(y_min, y_max, h))
    Z = method.predict(np.array([xx.ravel(), yy.ravel()]).T)
    Z = Z.reshape(xx.shape)
    plt.contourf(xx, yy, Z, alpha=0.2, cmap=colormap)
    plt.xlim(xx.min(), xx.max())
    plt.ylim(yy.min(), yy.max())
    for ix, lab in enumerate(np.unique(y)):
        spec = iris.target_names[lab]
        plt.scatter( x = X[y==lab,0], y = X[y==lab,1],
                     c=colormap(ix), marker=markers[ix], label=spec)
DecisionBoundary_plot(X= I_X.values, y= I_y, method=logit)
plt.xlabel('petal length (cm)')
plt.ylabel('petal width (cm)')
plt.legend(loc = 'upper left')
plt.show()
Question
利用經過 StandardScaler 轉換後的資料,建立Logistic Regression Model,並比較 Accuracy
Logistic Regression Model -- StandardScaler Data 
Data Prepare -- Training and testing
I_X_train_s, I_X_test_s, I_y_train_s, I_y_test_s = train_test_split( I_X_s, I_y, test_size = 0.3, random_state = 0)
Model
logit_s = LogisticRegression()
logit_s.fit( I_X_train_s, I_y_train_s )
LogisticRegression(C=1.0, class_weight=None, dual=False, fit_intercept=True,
          intercept_scaling=1, max_iter=100, multi_class='ovr', n_jobs=1,
          penalty='l2', random_state=None, solver='liblinear', tol=0.0001,
          verbose=0, warm_start=False)
Logistic Regression Model -- StandardScaler Data 
Predict
y_logit_predict_s = logit_s.predict( I_X_test_s )
Accuracy
print('Accuracy(Standard):',accuracy_score( I_y_test_s, y_logit_predict_s))
Accuracy(Standard): 0.8
經過標準化的資料, Accuracy 更好
Logistic Regression Model -- StandardScaler Data 
Plot ( Decision boundary )
DecisionBoundary_plot(X= I_X_s, y= I_y, method=logit_s)
plt.title('Iris (Standard)')
plt.xlabel('petal length (cm)')
plt.ylabel('petal width (cm)')
plt.legend(loc = 'upper left')
plt.show()
Note
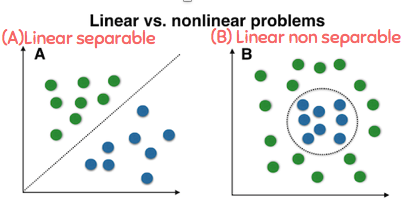
Linear VS Nonlinear
Note
Classification of linearly nonseparable
- K-nearest neighbor (KNN)
- Support Vector Machine (SVM)
- Decision Tree
from sklearn.neighbors import KNeighborsClassifier
Use KNeighborsClassifier
knn = KNeighborsClassifier()
knn.fit( I_X_train_s, I_y_train_s)
KNeighborsClassifier(algorithm='auto', leaf_size=30, metric='minkowski',
           metric_params=None, n_jobs=1, n_neighbors=5, p=2,
           weights='uniform')
y_knn_predict = knn.predict( I_X_test_s )
Compare Predict Value and Measure Value
pd.DataFrame( list(zip(iris.target_names[ I_y_test_s],
                       iris.target_names[ y_knn_predict])), columns=['Measured','Predicted'] )
| Measured | Predicted | |
|---|---|---|
| 0 | virginica | virginica |
| 1 | versicolor | versicolor |
| 2 | setosa | setosa |
| 3 | virginica | virginica |
| 4 | setosa | setosa |
| 5 | virginica | virginica |
| 6 | setosa | setosa |
| 7 | versicolor | versicolor |
| 8 | versicolor | versicolor |
| 9 | versicolor | versicolor |
| 10 | virginica | virginica |
| 11 | versicolor | versicolor |
| 12 | versicolor | versicolor |
| 13 | versicolor | versicolor |
| 14 | versicolor | versicolor |
| 15 | setosa | setosa |
| 16 | versicolor | versicolor |
| 17 | versicolor | versicolor |
| 18 | setosa | setosa |
| 19 | setosa | setosa |
| 20 | virginica | virginica |
| 21 | versicolor | versicolor |
| 22 | setosa | setosa |
| 23 | setosa | setosa |
| 24 | virginica | virginica |
| 25 | setosa | setosa |
| 26 | setosa | setosa |
| 27 | versicolor | versicolor |
| 28 | versicolor | versicolor |
| 29 | setosa | setosa |
| 30 | virginica | virginica |
| 31 | versicolor | versicolor |
| 32 | setosa | setosa |
| 33 | virginica | virginica |
| 34 | virginica | virginica |
| 35 | versicolor | versicolor |
| 36 | setosa | setosa |
| 37 | versicolor | versicolor |
| 38 | versicolor | versicolor |
| 39 | versicolor | versicolor |
| 40 | virginica | virginica |
| 41 | setosa | setosa |
| 42 | virginica | virginica |
| 43 | setosa | setosa |
| 44 | setosa | setosa |
from sklearn.metrics import accuracy_score
print('Accuracy:',accuracy_score( I_y_test_s, y_knn_predict))
Accuracy: 1.0
DecisionBoundary_plot(X= I_X_s, y= I_y, method=knn)
plt.xlabel('petal length (cm)')
plt.ylabel('petal width (cm)')
plt.legend(loc = 'upper left')
plt.show()
Note
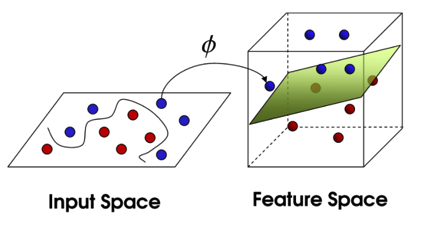
Support Vector Machine
- Radial basis function kernel $$ K( \, x,\acute{x} \, ) = exp(-\gamma \lVert x - \acute{x} \rVert^2 ) , where \, \gamma = \frac{1}{2 \sigma^2} $$
from sklearn.svm import SVC
Use SVC
svm = SVC(kernel = 'rbf', random_state = 0, gamma = 0.2)
svm.fit( I_X_train, I_y_train )
SVC(C=1.0, cache_size=200, class_weight=None, coef0=0.0,
  decision_function_shape='ovr', degree=3, gamma=0.2, kernel='rbf',
  max_iter=-1, probability=False, random_state=0, shrinking=True,
  tol=0.001, verbose=False)
y_svm_predict = svm.predict( I_X_test )
Compare Predict Value and Measure Value
pd.DataFrame( list(zip(iris.target_names[ I_y_test],
                       iris.target_names[ y_svm_predict])), columns=['Measured','Predicted'] )
| Measured | Predicted | |
|---|---|---|
| 0 | virginica | virginica |
| 1 | versicolor | versicolor |
| 2 | setosa | setosa |
| 3 | virginica | virginica |
| 4 | setosa | setosa |
| 5 | virginica | virginica |
| 6 | setosa | setosa |
| 7 | versicolor | versicolor |
| 8 | versicolor | versicolor |
| 9 | versicolor | versicolor |
| 10 | virginica | virginica |
| 11 | versicolor | versicolor |
| 12 | versicolor | versicolor |
| 13 | versicolor | versicolor |
| 14 | versicolor | versicolor |
| 15 | setosa | setosa |
| 16 | versicolor | versicolor |
| 17 | versicolor | versicolor |
| 18 | setosa | setosa |
| 19 | setosa | setosa |
| 20 | virginica | virginica |
| 21 | versicolor | versicolor |
| 22 | setosa | setosa |
| 23 | setosa | setosa |
| 24 | virginica | virginica |
| 25 | setosa | setosa |
| 26 | setosa | setosa |
| 27 | versicolor | versicolor |
| 28 | versicolor | versicolor |
| 29 | setosa | setosa |
| 30 | virginica | virginica |
| 31 | versicolor | versicolor |
| 32 | setosa | setosa |
| 33 | virginica | virginica |
| 34 | virginica | virginica |
| 35 | versicolor | versicolor |
| 36 | setosa | setosa |
| 37 | versicolor | virginica |
| 38 | versicolor | versicolor |
| 39 | versicolor | versicolor |
| 40 | virginica | virginica |
| 41 | setosa | setosa |
| 42 | virginica | virginica |
| 43 | setosa | setosa |
| 44 | setosa | setosa |
from sklearn.metrics import accuracy_score
print('Accuracy:',accuracy_score( I_y_test, y_svm_predict))
Accuracy: 0.977777777778
DecisionBoundary_plot(X= I_X.values , y= I_y, method=svm)
plt.xlabel('petal length (cm)')
plt.ylabel('petal width (cm)')
plt.legend(loc = 'upper left')
plt.show()
Question
利用經過 StandardScaler 轉換後的資料,建立SVM Model,並比較 Accuracy
Support Vector Machine ( SVM ) Model -- StandardScaler Data 
Data Prepare -- Training and testing
Model
svm_s = SVC(kernel = 'rbf', random_state = 0, gamma = 0.2)
svm_s.fit( I_X_train_s, I_y_train_s )
SVC(C=1.0, cache_size=200, class_weight=None, coef0=0.0,
  decision_function_shape='ovr', degree=3, gamma=0.2, kernel='rbf',
  max_iter=-1, probability=False, random_state=0, shrinking=True,
  tol=0.001, verbose=False)
Support Vector Machine ( SVM ) Model -- StandardScaler Data 
Predict
y_svm_predict_s = svm_s.predict( I_X_test_s )
Accuracy
print('Accuracy:',accuracy_score( I_y_test_s, y_svm_predict_s))
Accuracy: 0.977777777778
Support Vector Machine ( SVM ) Model -- StandardScaler Data 
Plot ( Decision boundary )
DecisionBoundary_plot(X= I_X_s, y=I_y, method=svm_s)
plt.xlabel('petal length (cm)')
plt.ylabel('petal width (cm)')
plt.legend(loc = 'upper left')
plt.show()
Note
Overfitting

Reference : http://mlwiki.org/index.php/Overfitting
Machine Learning Algorithms -- Unsupervised learning
- Unsupervised learning
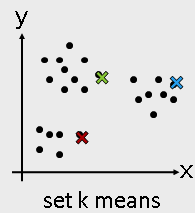
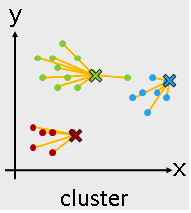
- K-means
- Hierarchical clustering
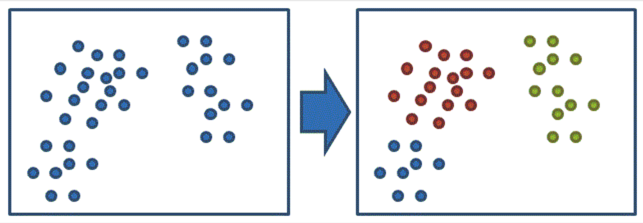
Reference : : https://dotblogs.com.tw/dragon229/2013/02/04/89919
from sklearn.cluster import KMeans
Use KMeans
kmeans = KMeans(n_clusters = 3)
kmeans_fit = kmeans.fit( I_X )
kmeans_result = kmeans_fit.labels_
Compare Original and Cluster
pd.DataFrame( list(zip(iris.target_names[I_y],
                       iris.target_names[kmeans_result])), columns=['Original','Cluster'] )
| Original | Cluster | |
|---|---|---|
| 0 | setosa | setosa |
| 1 | setosa | setosa |
| 2 | setosa | setosa |
| 3 | setosa | setosa |
| 4 | setosa | setosa |
| 5 | setosa | setosa |
| 6 | setosa | setosa |
| 7 | setosa | setosa |
| 8 | setosa | setosa |
| 9 | setosa | setosa |
| 10 | setosa | setosa |
| 11 | setosa | setosa |
| 12 | setosa | setosa |
| 13 | setosa | setosa |
| 14 | setosa | setosa |
| 15 | setosa | setosa |
| 16 | setosa | setosa |
| 17 | setosa | setosa |
| 18 | setosa | setosa |
| 19 | setosa | setosa |
| 20 | setosa | setosa |
| 21 | setosa | setosa |
| 22 | setosa | setosa |
| 23 | setosa | setosa |
| 24 | setosa | setosa |
| 25 | setosa | setosa |
| 26 | setosa | setosa |
| 27 | setosa | setosa |
| 28 | setosa | setosa |
| 29 | setosa | setosa |
| ... | ... | ... |
| 120 | virginica | versicolor |
| 121 | virginica | versicolor |
| 122 | virginica | versicolor |
| 123 | virginica | versicolor |
| 124 | virginica | versicolor |
| 125 | virginica | versicolor |
| 126 | virginica | virginica |
| 127 | virginica | versicolor |
| 128 | virginica | versicolor |
| 129 | virginica | versicolor |
| 130 | virginica | versicolor |
| 131 | virginica | versicolor |
| 132 | virginica | versicolor |
| 133 | virginica | versicolor |
| 134 | virginica | versicolor |
| 135 | virginica | versicolor |
| 136 | virginica | versicolor |
| 137 | virginica | versicolor |
| 138 | virginica | virginica |
| 139 | virginica | versicolor |
| 140 | virginica | versicolor |
| 141 | virginica | versicolor |
| 142 | virginica | versicolor |
| 143 | virginica | versicolor |
| 144 | virginica | versicolor |
| 145 | virginica | versicolor |
| 146 | virginica | versicolor |
| 147 | virginica | versicolor |
| 148 | virginica | versicolor |
| 149 | virginica | versicolor |
150 rows × 2 columns
from sklearn.metrics import silhouette_score
print('Silhouette:',silhouette_score( I_X, kmeans_result))
Silhouette: 0.660276088219
分群演算法的績效可以使用 Silhouette 係數
Question
利用經過 MinMaxScaler 轉換後的資料,做 K-Means Cluster,並比較 Silhouette
K-MeansModel -- MinMaxScaler Data 
Model
kmeans_fit_m = kmeans.fit( I_X_m )
kmeans_result_m = kmeans_fit_m.labels_
print('Silhouette:',silhouette_score( I_X_m, kmeans_result_m ))
Silhouette: 0.675805601905
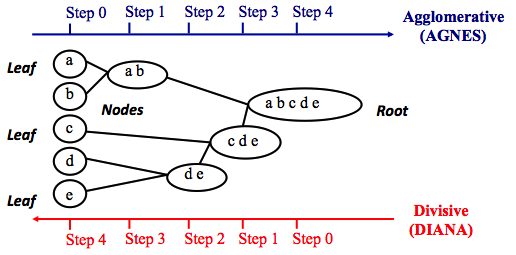
- Tries to combine or divide a dataset into clusters
- A tree-like hierarchical structure is created
- Can adopt two approaches :
- Agglomerative hierarchical clustering
- Divisive hierarchical clustering
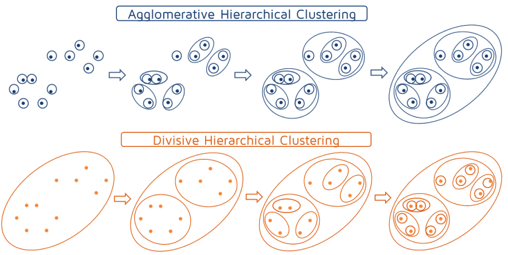
Reference : https://quantdare.com/hierarchical-clustering/
from sklearn.cluster import AgglomerativeClustering
Use AgglomerativeClustering
hierarchical = AgglomerativeClustering(linkage = 'ward', affinity = 'euclidean', n_clusters = 3)
hierarchical_fit = hierarchical.fit( I_X )
hierarchical_result = hierarchical_fit.labels_
Compare Original and Cluster
pd.DataFrame( list(zip(iris.target_names[I_y],
                       iris.target_names[hierarchical_result])), columns=['Measured','Predicted'] )
| Measured | Predicted | |
|---|---|---|
| 0 | setosa | versicolor |
| 1 | setosa | versicolor |
| 2 | setosa | versicolor |
| 3 | setosa | versicolor |
| 4 | setosa | versicolor |
| 5 | setosa | versicolor |
| 6 | setosa | versicolor |
| 7 | setosa | versicolor |
| 8 | setosa | versicolor |
| 9 | setosa | versicolor |
| 10 | setosa | versicolor |
| 11 | setosa | versicolor |
| 12 | setosa | versicolor |
| 13 | setosa | versicolor |
| 14 | setosa | versicolor |
| 15 | setosa | versicolor |
| 16 | setosa | versicolor |
| 17 | setosa | versicolor |
| 18 | setosa | versicolor |
| 19 | setosa | versicolor |
| 20 | setosa | versicolor |
| 21 | setosa | versicolor |
| 22 | setosa | versicolor |
| 23 | setosa | versicolor |
| 24 | setosa | versicolor |
| 25 | setosa | versicolor |
| 26 | setosa | versicolor |
| 27 | setosa | versicolor |
| 28 | setosa | versicolor |
| 29 | setosa | versicolor |
| ... | ... | ... |
| 120 | virginica | setosa |
| 121 | virginica | setosa |
| 122 | virginica | setosa |
| 123 | virginica | setosa |
| 124 | virginica | setosa |
| 125 | virginica | setosa |
| 126 | virginica | setosa |
| 127 | virginica | setosa |
| 128 | virginica | setosa |
| 129 | virginica | setosa |
| 130 | virginica | setosa |
| 131 | virginica | setosa |
| 132 | virginica | setosa |
| 133 | virginica | setosa |
| 134 | virginica | setosa |
| 135 | virginica | setosa |
| 136 | virginica | setosa |
| 137 | virginica | setosa |
| 138 | virginica | setosa |
| 139 | virginica | setosa |
| 140 | virginica | setosa |
| 141 | virginica | setosa |
| 142 | virginica | setosa |
| 143 | virginica | setosa |
| 144 | virginica | setosa |
| 145 | virginica | setosa |
| 146 | virginica | setosa |
| 147 | virginica | setosa |
| 148 | virginica | setosa |
| 149 | virginica | setosa |
150 rows × 2 columns
from sklearn.metrics import silhouette_score
print('Silhouette:',silhouette_score( I_X, hierarchical_result))
Silhouette: 0.657185644873
